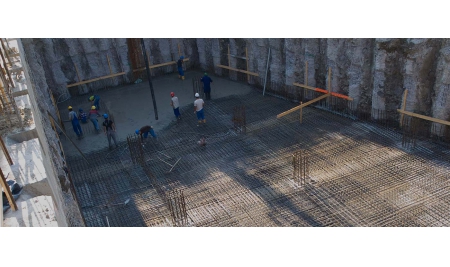
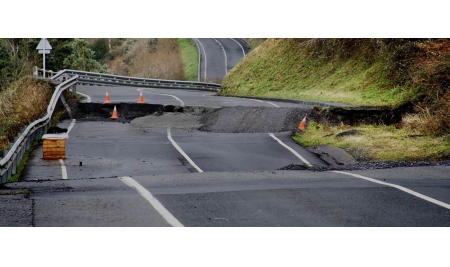
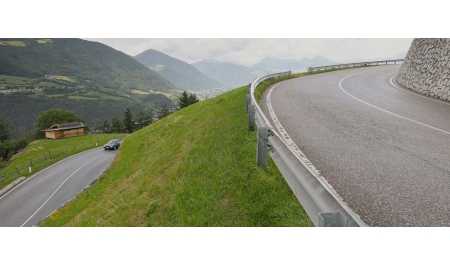
GeoStudio gói phần mềm mô hình hóa địa kỹ thuật dành cho các kỹ sư, chuyên gia địa kỹ thuật

GeoStudio
GeoStudio gói phần mềm mô hình hóa địa kỹ thuật danh cho các kỹ sư, chuyên gia địa kỹ thuật nhằm giải quyết các bài toán:
GeoStudio SLOPE/W - Phân tích ổn định mái dốc
SLOPE / W là phần mềm phân tích ổn định mái dốc hàng đầu cho đá và đất. SLOPE / W phân tích các vấn đề đơn giản và phức tạp đối với nhiều hình dạng bề mặt trượt, điều kiện áp lực nước lỗ rỗng, tính chất đất, và điều kiện tải.
Với phạm vi các tính năng này, SLOPE / W có thể được sử dụng để phân tích hầu hết các vấn đề ổn định dốc bạn sẽ gặp phải trong các dự án địa kỹ thuật, dân dụng, cầu đường và khai thác mỏ.

GeoStudio SEEP/W Phân tích dòng chảy ngầm trong đất
SEEP / W là một sản phẩm phần mềm mạnh mẽ để mô phỏng lưu lượng nước ngầm trong môi trường đất xốp. SEEP / W có thể mô phỏng các vấn đề ổn định trạng thái bão hòa đơn giản hoặc phân tích phức tạp bão hòa / không bão hòa với sự ảnh hưởng không khí tại bề mặt đất.
SEEP / W có thể được áp dụng cho việc phân tích và thiết kế các công trình kỹ thuật địa chất, dân dụng, địa chất thủy văn và khai thác mỏ.

GeoStudio SIGMA/W Phân tích ứng suất và biến dạng
SIGMA / W là sản phẩm phần mềm mạnh để mô hình hóa ứng suất và biến dạng trong đất và các vật liệu kết cấu. Phân tích SIGMA / W có thể bao gồm từ mô phỏng hồi quy tuyến tính đơn giản đến các vấn đề tương tác cấu trúc đất với các mô hình vật liệu phi tuyến.
Nhiều mô hình cấu thành đất cho phép bạn đại diện cho một loạt các loại đất hoặc vật liệu kết cấu. Thêm vào đó, mô hình SIGMA / W tạo áp suất nước lỗ rỗng và tiêu tán để đáp ứng với tải trọng bên ngoài. Với SIGMA / W bạn có thể phân tích gần như bất kỳ vấn đề ứng suất hoặc biến dạng nào bạn sẽ gặp phải.

GeoStudio QUAKE/W Phân tích động đất động
QUAKE / W là một sản phẩm phần mềm mạnh mẽ để mô hình hoá sự cố động đất và tải động. QUAKE / W xác định chuyển động và áp lực nước lỗ rỗng tăng lên do động đất, vụ nổ, hoặc các va chạm đột ngột.

GeoStudio TEMP/W Phân tích truyền nhiệt
TEMP / W là sản phẩm phần mềm phần tử hữu hạn để mô phỏng sự truyền nhiệt và thay đổi pha trong đất xốp. TEMP / W có thể phân tích các vấn đề từ đơn giản đến mô phỏng năng lượng bề mặt phức tạp với chu kỳ đông lạnh-tan băng.
Phần mềm này có thể được sử dụng cho các phân tích địa nhiệt và thiết kế các công trình địa kỹ thuật, dân dụng và khai thác mỏ, bao gồm các hệ thống chịu lạnh và thay đổi nhiệt độ tan băng.
GeoStudio CTRAN/W Phân tích chuyển pha và khí
CTRAN / W là một sản phẩm phần mềm mạnh mẽ để mô hình hoá chất tan và truyền khí trong môi trường xốp. CTRAN / W có thể được sử dụng để mô hình hóa các hệ thống phổ cập đơn giản thông qua các hệ thống phân tán va chạm phức tạp với các phản ứng bậc nhất.
CTRAN / W có thể được sử dụng để mô hình một loạt các vấn đề môi trường địa lý liên quan đến sự di chuyển của các loài hoặc khí tan được bắt nguồn từ nguồn nhân tạo hoặc tự nhiên.
GeoStudio AIR/W Phân tích chuyển tiếp không khí
AIR / W là một sản phẩm phần mềm mạnh mẽ để mô hình chuyển đổi không khí trong chất thải mỏ và các vật liệu xốp khác. AIR / W có thể được sử dụng để mô hình hóa một loạt các kịch bản, từ các vấn đề đơn giản về không khí chuyển pha cho đến các hệ thống nước không khí kết hợp.
Sức mạnh của AIR / W khi kết hợp với TEMP / W để mô hình dòng nhiệt không khí đối lưu và lưu lượng không khí phụ thuộc vào mật độ. Loại phân tích này rất quan trọng cho việc nghiên cứu việc đóng cửa mỏ, thoát nước đá axit, hoặc chuyển khí.
Một dự án đơn lẻ hoạc phức hợp
The integrated GeoStudio software suite allows you to combine multiple analyses using different products into a single modelling project. You can then use the results from one analysis as the starting conditions for another one. New analyses can be easily created by cloning an existing analysis and adjusting its properties. When you are ready to analyze the model, GeoStudio solves the analyses in the appropriate order, taking advantage of parallel processing.
This unique and powerful feature greatly expands the types of problems you can analyze. Use this approach to model construction sequences, establish initial conditions, perform sensitivity analyses, model complex time sequences, or simply decompose a complex problem into a number of smaller, more manageable analyses.
Included with the purchase of any GeoStudio single product or bundle is a free GeoStudio Basic license. Analyses created with a Geostudio Basic license can be included in the same file as the full-featured GeoStudio analysis, further unlocking the power of integration.
Nhiều chế độ view
Docking windows in GeoStudio allow you to view information in multiple views so you can quickly access the data you need. You can customize the display of docking windows to suit your particular needs. A status bar provides both view information and quick access to commands such as zooming, and a progress bar during lengthy operations such as solving.
Docking windows include an Analysis Explorer, Solve Manager, Result Times, Slip Surfaces, and Sensitivity Runs. The Analysis Explorer displays a tree view of the analyses in the project, allowing you to quickly change the analysis you are viewing. The Solve Manager allows you to solve one or more analyses and watch their progress even while continuing to work on another analysis. The Result Times window displays a list of time steps that have computed results. When you select a time step, all currently displayed views and dialog boxes show the results computed for the selected time.
The Slip Surfaces window displays a list of SLOPE/W computed trial slip surfaces. When you select a slip surface, the Results view will show the complete slip surface results. If detailed results are unavailable, GeoStudio will compute them on-demand, allowing you to view detailed forces or graphs on any particular slip surface without having to designate it as a "critical" slip surface.
The Sensitivity Runs window displays a list of runs performed for a sensitivity analysis. Each sensitivity run is now a complete slope stability analysis, allowing you to view all computed slip surface results for each individual run.
Định nghĩa hình học
Define Geometry using Drawing Tools or by Importing CAD files
Defining the geometry of the physical system is usually the first step in a numerical analysis. GeoStudio provides all the tools necessary to define the model domain including coordinate import, copy-paste geometric items, length and angle feedback, region merge, region split, and direct keyboard entry of coordinates, lengths, and angles. Otho-snapping to horizontal and vertical directions can be used to facilitate geometry definition.
AutoCAD DWG or DXF files can be imported directly into GeoStudio for the definition of domain geometry. In addition, image files can be imported, scaled, and the region geometry drawn directly over top.
Áp vật liệu
Apply Materials to the Domain for each Analysis
Once the domain regions are defined, you can apply material properties to each of the regions individually or as a group. Applying materials to individual regions allows you to model different materials in different analyses. You can also remove portions of the domain in different analysis by not applying materials to these regions; this allows each analysis to consider new regions added to the domain in stages.
Material properties can also be applied globally to all analyses in the project or to individual analyses. Applying materials across all analyses makes it easy to change your material definition when you are using many analyses in a single project.
Mô hình đất và đá
Define Soil and Rock Material Models using Flexible, Generalized Functions
GeoStudio makes broad use of generalized functions for material property and boundary condition definition. Enter parameters for pre-defined functions, or create your own functions using your own data. You can even write your own Add-In functions or constitutive models to compute material property values while the analysis is being solved, allowing you to extend GeoStudio in nearly infinite ways.
Chia lưới PTHH
Automated Finite Element Meshing of the Geometry
When materials are applied to the domain regions in a finite element analysis, a default finite element mesh is automatically generated. While in many cases the default mesh is adequate, you can adjust the mesh either globally or by applying constraints to specific locations. This allows you to keep a coarse mesh in most regions while applying a fine mesh within particular portions of the domain that may have highly nonlinear properties or boundary conditions. As you adjust the local constraints, GeoStudio re-generates the mesh over the entire domain, while still preserving your existing model definition.
Nhập tọa độ
Use the Keyboard to Enter Coordinates While Drawing Objects
Coordinates can be entered using your keyboard while any drawing command is active. This keyboard input option allows you to enter Point coordinates using the x-y coordinates, length and angle input, offset lengths in the x-y directions, or simply the Point numbers. A tooltip displays this information while drawing points using drawing commands such as Draw Regions. Undo and Redo is supported while using the drawing commands.
Công cụ lập trình
You can write supplemental programs called Add-Ins that will be called by the GeoStudio Solver when it solves your analyses. A Function Add-In takes the place of a function defined in GeoStudio, and offers the flexibility of computing function results that vary dynamically based on the current mesh state.
GeoStudio provides an Add-In API (“application programming interface”) that your Add-In can use to query parameter values while GeoStudio is solving the analysis. You can use these values to return the required function parameter value. You can also use the Add-In API to write out your own custom parameters for later viewing using the regular GeoStudio result visualization features.
Each Add-In function is an object that GeoStudio associates with either a node or gauss point, depending on the kind of function that references the Add-In. Boundary condition functions are assigned at nodes, and Material property functions at gauss points. There are many instances of the function object created when the solver runs, one for each node or gauss point where the function is used.
In SLOPE/W, an Add-In can be written to access data that exists at the base of a slice where that slice contacts the failure plane (or slip circle).
GeoStudio Add-Ins are based on Microsoft .NET, allowing you to write your Add-In using languages such as C#, F#, or VB.NET.
Hiệu quả
Efficient, Parallel Solving of the Project Analyses
GeoStudio runs each analysis solver in parallel, allowing multiple analyses to be solved efficiently on computers with modern, multi-core processors. When analysing a single problem, the appropriate GeoStudio solver will still perform much of the computations in parallel.
Hiển thị kết quả
Interpret Results with Powerful Graphing, Visualization, and Data Management
Interpretation is one of the most difficult aspects of numerical modelling. GeoStudio provides powerful tools for visualizing and interpreting the results:
- Graphing tools let you plot almost any computed parameter
- Contour plots display computed parameters that vary spatially over the domain
- Isolines display a single parameter value as a line in the domain
- Isolines computed at different times can be shown simultaneously on the domain
- Computed results over time can be plotted or animated in a movie
- Data can be interactively queried at any location
- Data can be exported and taken directly into a spreadsheet for further analysis
- Each GeoStudio product provides additional ways of interpreting the analysis results
Vật liệu & bảng điều kiện biên
Display a material and/or boundary condition table on the drawing. Customize the parameters to display in each table. Legends can also be displayed for contour plots and other visualization tools like factor of safety color maps in SLOPE/W.
Thêm nhãn, ghi chú & kích thước
Add Notes, Labels, Pictures, and Dimensions on the Drawing
Additional notes can be added as text to the drawing. Add any text you like, or use “dynamic” text that is connected to your model data. This allows you to place labels on the drawing that automatically update as the model changes.
Add pictures to your drawing such as a drawing created in AutoCAD, a corporate logo, or a photo of the site.
Dimension your drawing using aligned, linear, and angular dimension tools. The dimensions can lock to geometric objects, such as points or lines, and automatically resize if changes are made to the domain.
In ấn
Create a Printing Template in Page Layout Mode
The Page Layout mode allows for improved presentation of models and results. After setting up an analysis, you can switch to Page Layout to specify the printing properties, including page size and orientation, and drawing scale. This configuration can be saved as a template or an existing Page Layout configuration can be imported into the current file for consistent presentation of model results in multiple project files.
Công cụ Command Line
Automate GeoStudio with the GeoCmd Command Line Interface
GeoCmd is a command-line utility that makes it more convenient to work with large numbers of data files. You can automate GeoStudio to solve, upgrade, or generate reports for many project files sequentially.
Files
Upgrade Files from Older GeoStudio Versions and Save to Older Formats
GeoStudio can read in files created by any earlier version of GeoStudio. GeoStudio can also save your current project file as an older version, allowing you to continue working with other members of your team who are not using the latest GeoStudio version.
Đa ngôn ngữ
The GeoStudio user interface can be shown in multiple languages besides English, including Chinese, French and Spanish. When installing GeoStudio, you can select your preferred language or change it later.
Chưa có tài liệu
Sản phẩm liên quan
PLAXIS 2D
Price: Liên hệ
PLAXIS 2D Giải pháp phần mềm 2D phần tư hữu hạn ứng dụng trong...
Contact product
Register to buy
Download
PLAXIS 3D
Price: Liên hệ
PLAXIS 3D Giải pháp phần mềm 3D phần tử hữu hạn trong lĩnh vực...
Contact product
Register to buy
PLAXIS VIP
Price: Liên hệ
Plaxis VIP là một hệ thống đăng ký bổ sung dựa trên bản quyền truyền...
Contact product
Register to buy
PLAXIS MoDeTo
Price: Liên hệ
PLAXIS MoDeTo Dòng sản phẩm mới của PLAXIS ứng dụng thiết kế cọc monopile...
Contact product
Register to buy
Download
CIC TECHNOLOGY & CONSULTANCY JSC.
Head Quarter: 37 Le Dai Hanh Street - Hai Ba Trung District - Hanoi City - Vietnam
Phone: (+84 24) 39 761 381 / (+84 24) 39 741 313
Email: info@cic.com.vn
Website: https://www.cic.com.vn
Ho Chi Minh Branch: 36 Nguyen Huy Luong Street - Ward 14 - Binh Thanh District - Ho Chi Minh City - Vietnam
Phone: (+84 28) 628 99 022 / (+84 28) 628 99 033
Email: cichcm@cic.com.vn
Products
Dịch vụ
Connect to facebook


